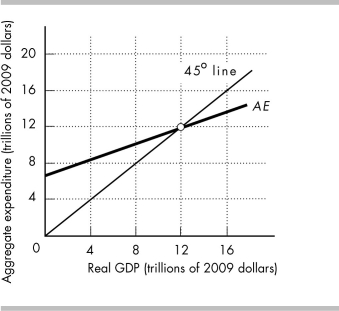
-The above figure shows the AE curve and 45° line for an economy.
a) If real GDP equals $8 trillion, how do firms' inventories compare to their planned inventories?
b) If real GDP equals $16 trillion, how do firms' inventories compare to their planned inventories?
c) What is the equilibrium level of expenditure? Why is this amount the equilibrium?
Correct Answer:
Verified
View Answer
Unlock this answer now
Get Access to more Verified Answers free of charge
Q423: "If the income tax rate is high
Q424: When disposal income is $5.0 trillion, consumption
Q425: How do imports and income taxes affect
Q426: An increase in the price level shifts
Q427: Explain what happens to equilibrium expenditure if
Q429: "When the price level increases, aggregate planned
Unlock this Answer For Free Now!
View this answer and more for free by performing one of the following actions

Scan the QR code to install the App and get 2 free unlocks

Unlock quizzes for free by uploading documents