The table below shows data for the U.S. 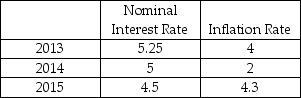 Between 2014 and 2015 the real interest rate ________ and caused a ________ the demand for loanable funds curve.
A) increased; rightward shift
B) decreased; movement down along
C) increased; movement up along
D) decreased; leftward shift
Correct Answer:
Verified
Q191: If the Ricardo-Barro effect occurs, an _
Q192: In 2007, France's GDP totaled $1.9 trillion
Q193: In 2007, France's GDP totaled $1.9 trillion
Q194: In 2010, the United States and foreign
Q195: The table below shows data for the
Q197: In 2008, the financial and housing crisis
Q198: In 2007, Singapore's government ran a budget
Q199: A decrease in the government budget deficit
Q200: The University of Central Florida (UCF) wanted
Q201: How does an increase in the expected
Unlock this Answer For Free Now!
View this answer and more for free by performing one of the following actions

Scan the QR code to install the App and get 2 free unlocks

Unlock quizzes for free by uploading documents