Figure 5-1
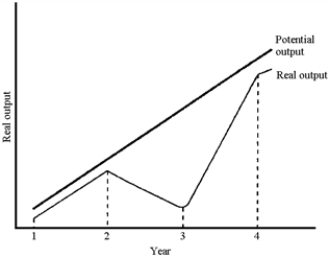
-Figure 5-1 plots potential and real output for a hypothetical economy.Based on this graph, the recession occurred
A) between years 1 and 2.
B) between years 2 and 3.
C) between years 3 and 4.
D) after year 4.
Correct Answer:
Verified
Q122: Since countries differ in the amount of
Q123: What was not an effect of the
Q124: Consider the economic impact of Hurricane Florence
Q125: How does the calculation of GDP include
Q126: "Underground" economic activity can best be described
Q128: Large sport utility vehicles (SUVs) add significantly
Q129: In the past 100 years, the U.S.economy
Q130: In the period of U.S.economic history known
Q131: Stabilization policy describes
A)government programs designed to prevent
Q132: The Great Depression of the 1930s
A)confirmed the
Unlock this Answer For Free Now!
View this answer and more for free by performing one of the following actions

Scan the QR code to install the App and get 2 free unlocks

Unlock quizzes for free by uploading documents