Multiple Choice
Figure 7-9 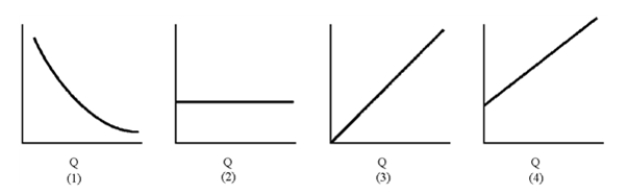
-Of the graphs in Figure 7-9, which represents average fixed cost?
A) 1
B) 2
C) 3
D) 4
Correct Answer:
Verified
Related Questions
Q171: Figure 7-7 Q172: Figure 7-8 Q173: Which of the following is most likely Q174: Figure 7-10 Q175: Figure 7-5 Q177: Figure 7-5 Q178: Figure 7-7 Q179: Figure 7-8 Q180: Which of the following is correct? Q181: Figure 7-13 Unlock this Answer For Free Now! View this answer and more for free by performing one of the following actions Scan the QR code to install the App and get 2 free unlocks Unlock quizzes for free by uploading documents![]()
![]()
![]()
![]()
![]()
![]()
![]()
A)AC =![]()

