The diagram below shows upper and lower sums for the function 
Using 4 subintervals. Use upper and lower sums to approximate the area of the region using the 4 subintervals.
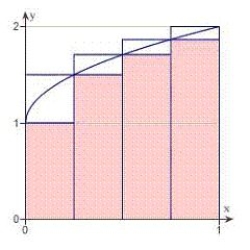
A) lower: 1.518; upper: 1.768
B) lower: 6.072; upper: 7.072
C) lower: 3.036; upper: 3.536
D) lower: 1.268; upper: 2.018
Correct Answer:
Verified
Q117: Use the summation formulas to rewrite the
Q118: Find the indefinite integral Q119: Sketch the region whose area is given Q120: Find the indefinite integral of the following Q121: Find the integral Q123: Evaluate the limit Q124: Find the area of the shaded region Q125: Find the indefinite integral of the following Q126: Find the indefinite integral of the following Q127: Find the indefinite integral Unlock this Answer For Free Now! View this answer and more for free by performing one of the following actions Scan the QR code to install the App and get 2 free unlocks Unlock quizzes for free by uploading documents![]()
![]()
![]()
![]()

