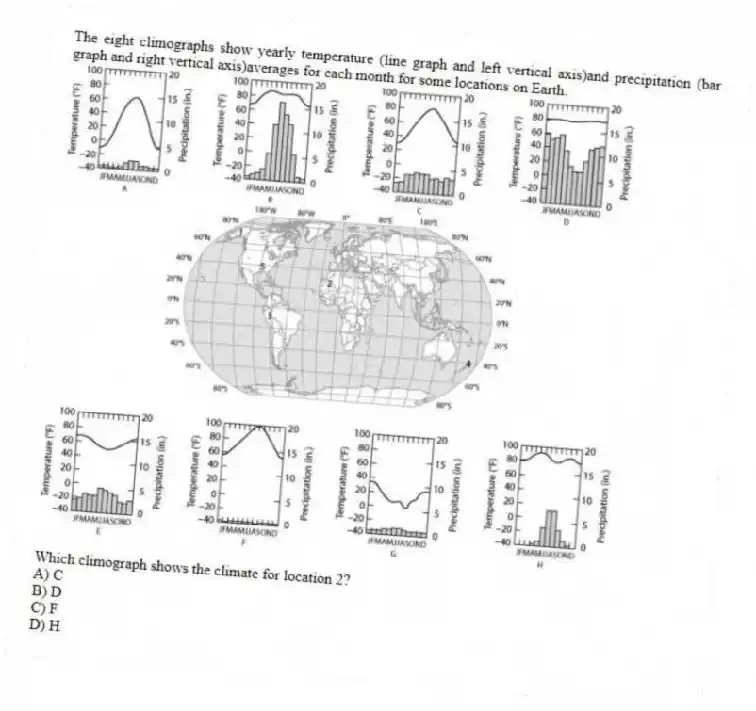
The eight climographs show yearly temperature (line graph and left vertical axis) and precipitation (bar graph and right vertical axis) averages for each month for some locations on Earth.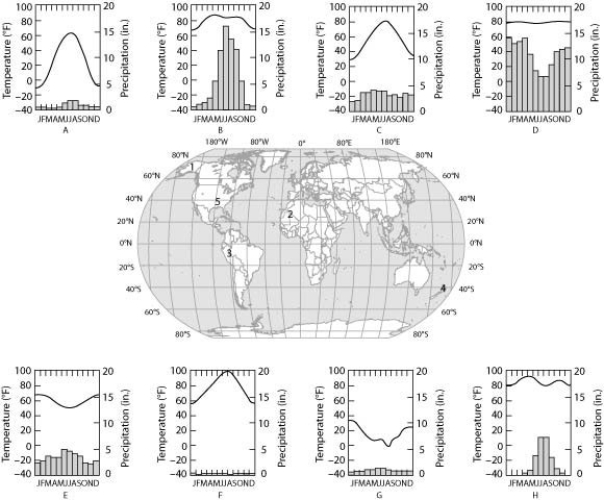
Which climograph shows the climate for location 2?
A) C
B) D
C) F
D) H
Correct Answer:
Verified
Q24: The eight climographs show yearly temperature (line
Q25: The eight climographs show yearly temperature (line
Q26: Use the following figures to answer the
Q26: Which of the following is an important
Q27: Use the following figure to answer the
Q28: Use the following figures to answer the
Q30: The eight climographs show yearly temperature (line
Q33: The eight climographs show yearly temperature (line
Q34: Suppose that the number of bird species
Q40: If you conclude that vegetation at every
Unlock this Answer For Free Now!
View this answer and more for free by performing one of the following actions

Scan the QR code to install the App and get 2 free unlocks

Unlock quizzes for free by uploading documents