Use the following to answer questions:
Figure: Monopoly Profits in Duopoly 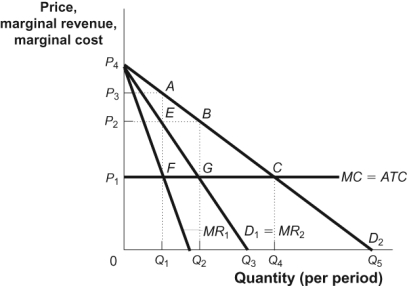
-(Figure: Monopoly Profits in Duopoly) The figure Monopoly Profits in Duopoly shows how an industry consisting of two firms that face identical demand curves (D1) can collude to increase profits. The market demand curve is D2. If the firms collude to share the market demand equally, then each firm will act as if its demand curve is given by:
A) D1.
B) D2.
C) MR1.
D) 2 × D1.
Correct Answer:
Verified
Q71: Use the following to answer questions:
Q72: Use the following to answer questions:
Figure: Monopoly
Q73: Use the following to answer questions:
Figure: Monopoly
Q74: Use the following to answer questions:
Figure: Monopoly
Q75: Use the following to answer questions:
Figure: Monopoly
Q77: Use the following to answer questions:
Figure: Collusion
Q78: Use the following to answer questions:
Q79: Use the following to answer questions:
Figure: Monopoly
Q80: Use the following to answer questions:
Figure: Collusion
Q92: An action is a dominant strategy when
Unlock this Answer For Free Now!
View this answer and more for free by performing one of the following actions

Scan the QR code to install the App and get 2 free unlocks

Unlock quizzes for free by uploading documents