The graph shown represents the cost and revenue curves faced by a monopoly. 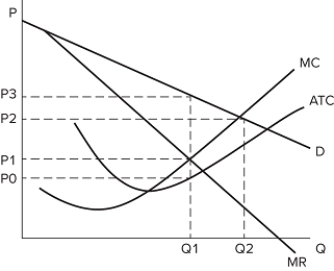 If Q2 units are being produced, the monopolist:
A) is earning negative profits.
B) should decrease production to increase profits.
C) is maximizing revenue.
D) is maximizing profits.
Correct Answer:
Verified
Q79: Producing any quantity of output less than
Q80: For a monopolist, at the profit-maximizing level
Q81: The graph shown represents the cost and
Q82: The presence of a privately-owned monopoly is
Q83: This graph shows the cost and revenue
Q85: What is one reason a firm may
Q86: The graph shown represents the cost and
Q87: This graph shows the cost and revenue
Q88: The graph shown represents the cost and
Q89: The graph shown represents the cost and
Unlock this Answer For Free Now!
View this answer and more for free by performing one of the following actions

Scan the QR code to install the App and get 2 free unlocks

Unlock quizzes for free by uploading documents