The graph shown displays a market with an externality. 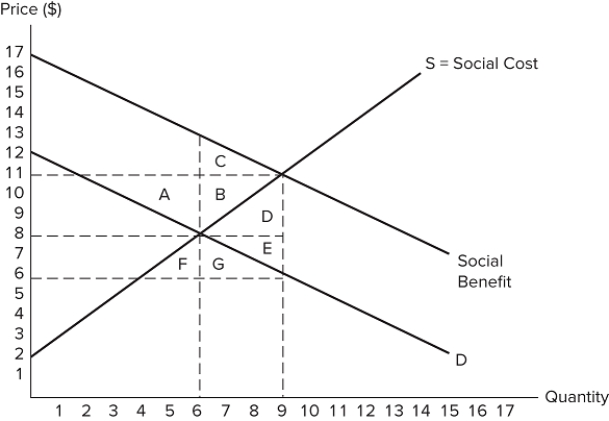 Which areas represent deadweight loss?
A) A + B
B) C + B
C) D + E
D) F + G
Correct Answer:
Verified
Q41: When positive consumption externalities are present in
Q42: When a positive externality is present in
Q43: If the social benefit is greater than
Q44: If it is possible to eliminate the
Q45: When a market is fully corrected for
Q47: The graph shown displays a market with
Q48: The net increase to total surplus when
Q49: The graph shown displays a market with
Q50: The graph shown displays a market with
Q51: A market with a positive externality has
Unlock this Answer For Free Now!
View this answer and more for free by performing one of the following actions

Scan the QR code to install the App and get 2 free unlocks

Unlock quizzes for free by uploading documents