Multiple Choice
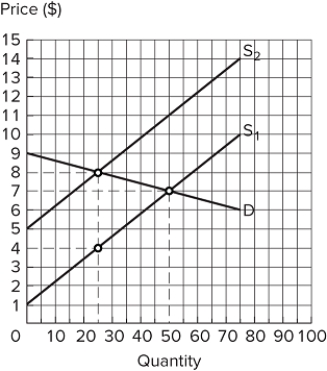 Assume the market shown in the graph is in equilibrium at demand (D) and supply (S1) . If the supply curve shifts to S2, total surplus falls by:
A) $50.
B) $75.
C) $150.
D) $200.
Correct Answer:
Verified
Related Questions
Assume the market shown in the graph is in equilibrium at demand (D) and supply (S1) . If the supply curve shifts to S2, total surplus falls by:
A) $50.
B) $75.
C) $150.
D) $200.
Correct Answer:
Verified

