The graph below shows atmospheric concentration of CO2 as recorded at the Mauna Loa Observatory. From the graph we can see that there are seasonal fluctuations in CO2 concentrations that correspond with: 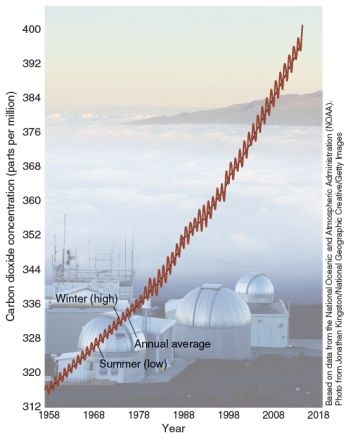
A) Plants taking up more carbon dioxide in the growing season.
B) Temperatures fluctuating between day and night.
C) Plants releasing more carbon dioxide in the growing season.
D) Cattle producing more methane in the summer when they are grazing.
Correct Answer:
Verified
Q5: The amount of water vapor in the
Q6: In science the terms climate and weather
Q7: Which is true for solar radiation?
A)It powers
Q8: Which of the following greenhouse gases has
Q9: _ is typical weather patterns that occur
Q11: Of the various factors that determine an
Q12: How much does the Intergovernmental Panel on
Q13: _ refers to conditions in the atmosphere
Q14: Besides temperature records, evidence that points to
Q15: Which of the following is not a
Unlock this Answer For Free Now!
View this answer and more for free by performing one of the following actions

Scan the QR code to install the App and get 2 free unlocks

Unlock quizzes for free by uploading documents