Below is a frequency table showing the number of new restaurants opened in the city over the past 24 months.Compute the variance of the number of openings data.Treat the data as a population. 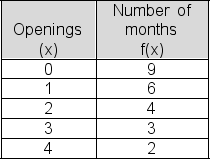
A) 1.71
B) 1.15
C) 2.58
D) 1.09
E) 2.76
Correct Answer:
Verified
Q91: Below is a frequency table showing the
Q92: Carnival Cruise Lines reported the number of
Q93: Carnival Cruise Lines reported the number of
Q94: The table shows the life expectancy in
Q95: Purchasing agent Angela Rodriguez reported the number
Q97: Carnival Cruise Lines reported the number of
Q98: For a sample of 10 days, Harkin
Q99: The table shows the life expectancy in
Q100: The table shows the life expectancy in
Q101: In a recent survey, 75 college students
Unlock this Answer For Free Now!
View this answer and more for free by performing one of the following actions

Scan the QR code to install the App and get 2 free unlocks

Unlock quizzes for free by uploading documents