The following probability distribution represents the number of vehicles available for use by a randomly selected US household.To simplify matters, the category "three or more" is replaced by "3" (Source: US Census, American FactFinder) .Calculate the standard deviation of the number of vehicles available per household. 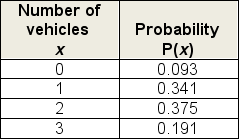
A) 0.11
B) 0.79
C) 0.89
D) 1.12
E) 1.45
Correct Answer:
Verified
Q60: The number of re-tweets of your Twitter
Q61: Approximately 1% of all USPS package deliveries
Q62: For a binomial distribution, find P(3 <
Q63: Approximately 1% of all USPS package deliveries
Q64: For a binomial distribution, find P(x >
Q66: It is reported that 23% of the
Q67: The following probability distribution represents the number
Q68: It is reported that 7% of the
Q69: The following probability distribution represents the number
Q70: Five percent of all international video calls
Unlock this Answer For Free Now!
View this answer and more for free by performing one of the following actions

Scan the QR code to install the App and get 2 free unlocks

Unlock quizzes for free by uploading documents