The partially completed contingency table below shows "observed" frequencies in a sample of size 400: 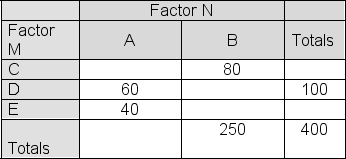 Fill in the table below with the "expected" cell frequencies if Factor M and Factor N are independent.
 Report the correct value for cell E,B in the expected frequency table.
A) 62.5
B) 106.25
C) 37.5
D) 48.75
Correct Answer:
Verified
Q128: In a chi-square distribution with nine degrees
Q129: A 2012 Gallup poll of collected
Q130: Pollsters have tracked presidential approval ratings
Q131: You have selected a sample to use
Q132: The partially completed contingency table below shows
Q134: A random sample of 100 skiers at
Q135: In a chi-square distribution with six degrees
Q136: The partially completed contingency table below shows
Q137: You have selected a sample to use
Q138: A random sample of 100 skiers at
Unlock this Answer For Free Now!
View this answer and more for free by performing one of the following actions

Scan the QR code to install the App and get 2 free unlocks

Unlock quizzes for free by uploading documents