A random sample of 100 members is selected from the population of UTU union members.A second sample, this one of size 200, is selected from the population of AFB union members.A third sample, also of size 200, is selected from the population of CCO union members.You use your results to fill in the table below showing the number of members in each sample who are satisfied with the representation that their union provides. 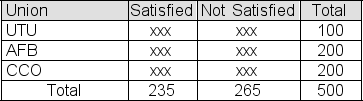 You then use a chi-square test to test the null hypothesis that the three union populations represented here contain the same proportion of satisfied members.The significance level for the test is 5%.If he p-value for the sample result turns out to be .0441, what should you conclude?
A) Don't reject the hypothesis that the proportion of satisfied members is not the same in all three union populations.
B) Reject the hypothesis that the proportion of satisfied members is different in the three union populations.
C) The sample provides strong evidence that the proportion of satisfied members is the same in all three union populations.
D) The sample provides strong evidence that the proportion of satisfied members is not the same in all three union populations.
Correct Answer:
Verified
Q65: In its most recent annual report, the
Q66: A random sample of 100 members is
Q67: A random sample of 100 members is
Q68: Alpine Research has conducted a survey of
Q69: In its most recent annual report, the
Q71: A random sample of 100 members is
Q72: Alpine Research has conducted a survey of
Q73: A sample of 100 colored balls is
Q74: A sample of 100 colored balls is
Q75: A random sample of 100 members is
Unlock this Answer For Free Now!
View this answer and more for free by performing one of the following actions

Scan the QR code to install the App and get 2 free unlocks

Unlock quizzes for free by uploading documents