A random sample of 100 members is selected from the population of UTU union members.A second sample, this one of size 200, is selected from the population of AFB union members.A third sample, also of size 200, is selected from the population of CCO union members.The table below shows the number of members in each sample who are satisfied with the representation that their union provides. 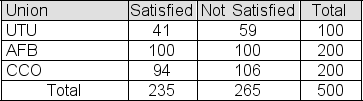 You use a chi-square test to test the null hypothesis that the three union populations represented here contain the same proportion of satisfied members.Report the p-value that for your test.(You will need a statistical calculator.)
A) .217
B) .141
C) .338
D) .102
Correct Answer:
Verified
Q75: A random sample of 100 members is
Q76: A sample of 100 colored balls is
Q77: A sample of 100 colored balls is
Q78: Alpine Research has conducted a survey of
Q79: Alpine Research has conducted a survey of
Q81: The HR manager at Hernandez Inc.reports that
Q82: Economic Review reported that for 50% of
Q83: CitySearch.com reports that 55% of its users
Q84: In its most recent annual report, the
Q85: Economic Review reported that for 50% of
Unlock this Answer For Free Now!
View this answer and more for free by performing one of the following actions

Scan the QR code to install the App and get 2 free unlocks

Unlock quizzes for free by uploading documents