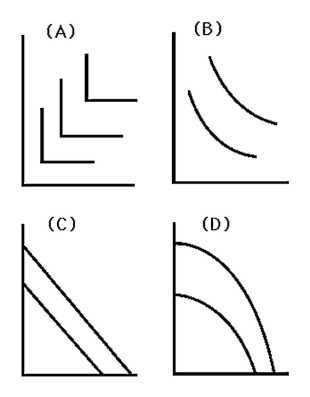
-Which graph in the above figure represents the isoquants where, as the amount of labor used increases and the amount of capital used decreases, the marginal product of labor rises (units of capital per day is on the vertical axis and units of labor per day is on the horizontal axis) ?
A) Graph A
B) Graph B
C) Graph C
D) Graph D
Correct Answer:
Verified
Q57: One way to explain the convexity of
Q62: L-shaped isoquants imply that production requires that
Q66: Isoquants that are downward-sloping straight lines imply
Q67: Which of the following is an example
Q68: Q69: If a firm fired one worker and Q70: With capital on the vertical axis and Q72: The marginal rate of technical substitution shows Q74: The marginal rate of technical substitution always Q76: ![]()
A)how![]()
Unlock this Answer For Free Now!
View this answer and more for free by performing one of the following actions

Scan the QR code to install the App and get 2 free unlocks

Unlock quizzes for free by uploading documents