Figure: The Optimal Consumption Bundle 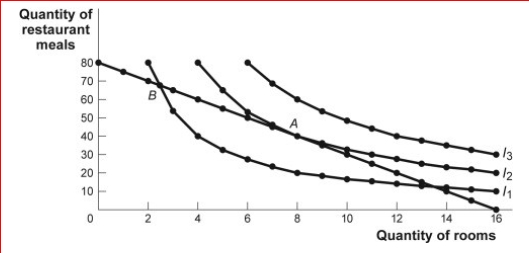
 (Figure: The Optimal Consumption Bundle) Look at the figure The Optimal Consumption Bundle.In the figure, which of the following could lead to an optimal consumption bundle on indifference curve I3?
A) an increase in income
B) an increase in the price of restaurant meals
C) an increase in the price of rooms
D) a decrease in income
Correct Answer:
Verified
Q34: A _ can be generated from indifference
Q116: Suppose the government decides to help poor
Q117: Figure: Income and Substitution Effects
(Figure: Income and
Q119: Javon is consuming his optimal utility-maximizing consumption
Q120: Suppose peanut butter is an inferior good
Q122: Figure: The Consumption of Video Games and
Q123: Figure: Indifference Curves and Consumption Bundles
Q125: Figure: The Optimal Consumption Bundle 
Q126: Figure: Harold's Indifference Curves The figure shows
Q190: In terms of indifference curves, a demand
Unlock this Answer For Free Now!
View this answer and more for free by performing one of the following actions

Scan the QR code to install the App and get 2 free unlocks

Unlock quizzes for free by uploading documents