Figure: The Quantity of Pollution 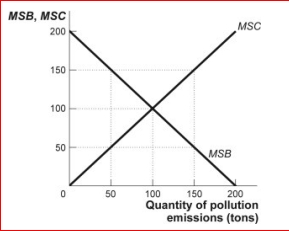
 (Figure: The Quantity of Pollution) Look at the table The Quantity of Pollution.When this economy produces 50 tons of emissions, it:
A) is producing below its socially optimal level of production.
B) finds that the marginal social cost is greater than the marginal social benefit.
C) is not recognizing the marginal private benefits or costs.
D) is producing at its socially optimal level of production.
Correct Answer:
Verified
Q168: What is meant by a negative externality?
Q171: What is meant by a positive externality?
Q212: Emissions taxes and tradable emissions permits both
Q213: If pollution is such a bad thing,
Q214: Figure: The Quantity of Pollution 
Q215: An emissions tax will:
A)ensure that the marginal
Q217: In an unregulated market, how much pollution
Q218: Why do economists argue that an emissions
Q219: Industrial production of goods creates pollution that
Q221: Scenario: Private and External Benefits A small
Unlock this Answer For Free Now!
View this answer and more for free by performing one of the following actions

Scan the QR code to install the App and get 2 free unlocks

Unlock quizzes for free by uploading documents