Figure: Efficiency and Pollution 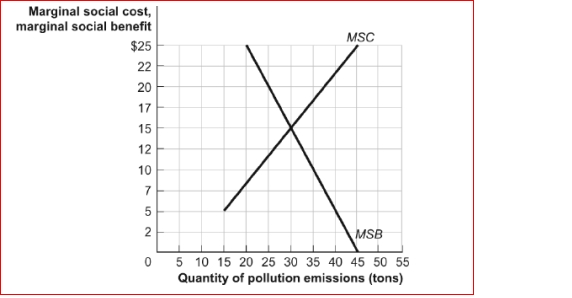 (Figure: Efficiency and Pollution) Look at the figure Efficiency and Pollution.The socially optimal quantity of pollution is:
A) 0 tons.
B) 20 tons.
C) 30 tons.
D) 45 tons.
Correct Answer:
Verified
Q166: Figure: Efficiency and Pollution Q167: Figure: MSB and MSC of Pollution Q168: Figure: Efficiency and Pollution Q169: Figure: Negative Externalities and Raising Pigs for Q170: Figure: Efficiency and Pollution Q172: Figure: Model of a Competitive Market Q173: Figure: Efficiency and Pollution Q174: Figure: MSB and MSC of Pollution Q175: (Figure: MSB and MSC of Pollution) The Q176: Figure: Negative Externalities and Raising Pigs for Unlock this Answer For Free Now! View this answer and more for free by performing one of the following actions Scan the QR code to install the App and get 2 free unlocks Unlock quizzes for free by uploading documents![]()
(Figure: Efficiency and Pollution)![]()
![]()

