Figure: The Optimal Quantity of Pollution 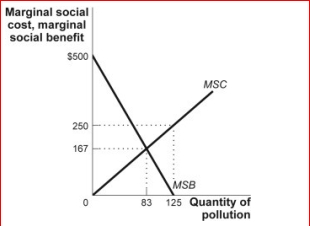
 (Figure: The Optimal Quantity of Pollution) The figure The Optimal Quantity of Pollution shows the marginal social cost (MSC) and marginal social benefit (MSB) for firms that pollute the air with sulfur dioxide.Using the figure, the optimal Pigouvian tax per unit of pollution is:
A) $500.
B) $250.
C) $167.
D) $83.
Correct Answer:
Verified
Q102: If the number of available tradable emissions
Q105: With tradable emissions permits, if the demand
Q109: Which of the following best describe tradable
Q110: If the number of available tradable emissions
Q110: An advantage of tradable emissions permits is
Q111: The licenses that can be bought and
Q112: Assume the price of a tradable emissions
Q113: There are two plants (A and B)
Q115: Which of the following is an environmental
Q119: With tradable emissions permits,the price of the
Unlock this Answer For Free Now!
View this answer and more for free by performing one of the following actions

Scan the QR code to install the App and get 2 free unlocks

Unlock quizzes for free by uploading documents