Figure: Change in the Total Surplus
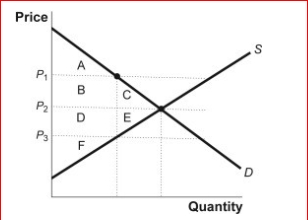
 (Figure: Change in Total Surplus) Look at the figure Change in the Total Surplus.Which of the following areas represent the change in total surplus when the price falls from P₂ to P₃?
A.A, B, and C
B.B and C
C.B, C, D, and E
D.C and E
Correct Answer:
Verified
Q107: Market failure refers to a situation in
Q146: Gehrig is willing to pay $90 for
Q148: Figure: The Wireless Mouse Market

Q149: Which of the following is a key
Q152: Figure: The Wireless Mouse Market
(Figure: Wireless Mouse
Q153: All of the following are possible reasons
Q155: In the market for corn, total surplus
Q163: Consumer surplus is the amount buyers actually
Q175: All else equal,when the supply curve shifts
Q180: Floyd's cost of selling haircuts is the
Unlock this Answer For Free Now!
View this answer and more for free by performing one of the following actions

Scan the QR code to install the App and get 2 free unlocks

Unlock quizzes for free by uploading documents