Figure: Change in the Total Surplus
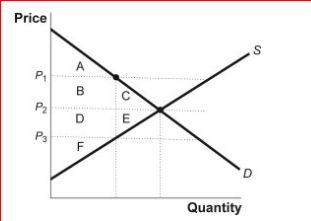
 (Figure: Change in Total Surplus) Look at the figure Change in the Total Surplus.Which of the following areas represent the change in total surplus when the price falls from P₁ to P₂?
A.A, B, and C
B.B and C
C.B, C, D, and E
D.C and E
Correct Answer:
Verified
Q137: Suppose a competitive market has a downward-sloping
Q139: Figure: Consumer and Producer Surplus
(Figure: Consumer and
Q140: If there is a decrease in demand,
Q146: Gehrig is willing to pay $90 for
Q163: Consumer surplus is the amount buyers actually
Q164: Peanut butter is an inferior good.If there
Q171: If the cost of soybeans (the major
Q172: A consumer's willingness to pay for a
Q175: All else equal,when the supply curve shifts
Q177: Producer surplus is the amount sellers receive
Unlock this Answer For Free Now!
View this answer and more for free by performing one of the following actions

Scan the QR code to install the App and get 2 free unlocks

Unlock quizzes for free by uploading documents