Figure: The Demand Curve for Bridge Crossings
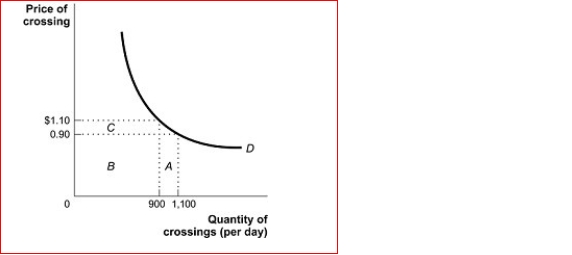 (Figure: The Demand Curve for Bridge Crossings) Look again at the figure The Demand Curve for Bridge Crossings.Demand is price between $0.90 and $1.10, since total
revenue ________ when the price _.
A.elastic; increases; decreases
B.inelastic; stays the same; decreases
C.unit-elastic; stays the same; increases
D.inelastic; increases; increases
Correct Answer:
Verified
View Answer
Unlock this answer now
Get Access to more Verified Answers free of charge
Q71: The price elasticity of demand along a
Q75: On a linear demand curve:
A)demand is elastic
Q80: The price elasticity of demand along a
Q124: Figure: The Demand for Shirts

Q126: Figure: The Demand for Shirts
Q128: A linear demand curve:
A.has a constant price
Q129: On a linear demand curve, the price
Q130: Figure: The Demand for Shirts
Q131: Figure: The Market for e-Books
(Figure: The Market
Q132: Figure: The Demand for Shirts
Unlock this Answer For Free Now!
View this answer and more for free by performing one of the following actions

Scan the QR code to install the App and get 2 free unlocks

Unlock quizzes for free by uploading documents