Figure: The Demand Curve for Bridge Crossings
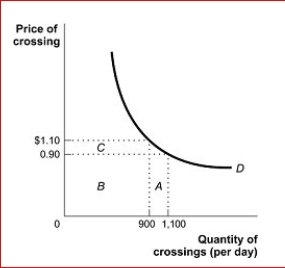
 (Figure: The Demand Curve for Bridge Crossings) Look at the figure The Demand Curve for Bridge Crossings.The price elasticity of demand between $0.90 and $1.10 in the figure is:
A.price-elastic, since the price elasticity is less than 1.
B.price unit-elastic, since the price elasticity is equal to 1.
C.price-elastic, since the price elasticity is a negative number.
D.price-inelastic, since the price elasticity is less than 1.
Correct Answer:
Verified
View Answer
Unlock this answer now
Get Access to more Verified Answers free of charge
Q130: Figure: The Demand for Shirts 
Q131: Figure: The Market for e-Books
(Figure: The Market
Q132: Figure: The Demand for Shirts
Q133: Figure: The Market for e-Books
(Figure: The Market
Q134: Figure: The Market for e-Books
(Figure: The Market
Q136: Figure: The Demand for Shirts
Q137: Figure: The Demand for Shirts
Q138: Figure: The Demand for Shirts
Q139: Figure: The Demand for Shirts
Q140: Figure: The Demand for Shirts
Unlock this Answer For Free Now!
View this answer and more for free by performing one of the following actions

Scan the QR code to install the App and get 2 free unlocks

Unlock quizzes for free by uploading documents