Figure: The Demand Curve for Oil
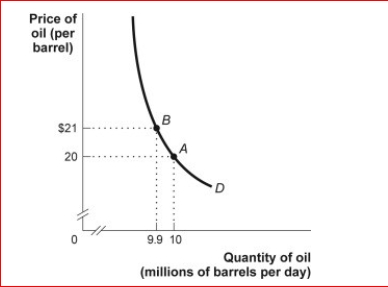
 (Figure: The Demand Curve for Oil) Look at the figure The Demand Curve for Oil.In the figure, the price elasticity of demand between $20 and $21 is:
A.price-elastic, since the price elasticity is less than 1.
B.price unit-elastic, since the price elasticity is equal to 1.
C.price-elastic, since the price elasticity is a negative number.
D.price-inelastic, since the price elasticity is less than 1.
Correct Answer:
Verified
View Answer
Unlock this answer now
Get Access to more Verified Answers free of charge
Q50: After a price decrease,the quantity effect tends
Q63: If the price elasticity of demand is
Q74: If total revenue goes up when the
Q98: Figure: The Demand for Notebook Computers
Q99: Suppose the price elasticity of demand for
Q100: The demand for agricultural output is price
Q101: Which of the following will lead to
Q102: When the percentage change in quantity demanded
Q104: Figure: Estimating Price Elasticity Q107: Figure: Demand Curves
![]()
![]()
Unlock this Answer For Free Now!
View this answer and more for free by performing one of the following actions

Scan the QR code to install the App and get 2 free unlocks

Unlock quizzes for free by uploading documents