Multiple Choice
Figure: The Demand Curve for Crossings 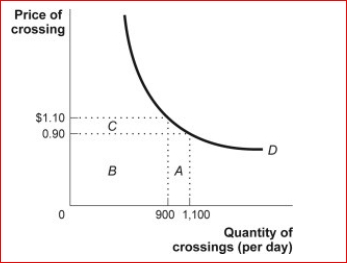
 (Figure: The Demand Curve for Crossings) Look at the figure The Demand Curve for Crossings.This graph examines the demand for crossing a bridge over a very large river.Using the midpoint method, the price elasticity of demand between $0.90 and $1.10 is approximately:
A) 0.1.
B) 0.2.
C) 1.
D) 1.9.
Correct Answer:
Verified
Related Questions
Q43: Table: Price Elasticity
(Table: Price Elasticity) Look at
Q44: Each month Jessica buys exactly 15 Big
Q45: Table: Price Elasticity
(Table: Price Elasticity) Look again
Q46: Table: Price Elasticity Q47: Table: Price Elasticity![]()
(Table: Price Elasticity) Look again

