Figure: The Demand Curve for Oil 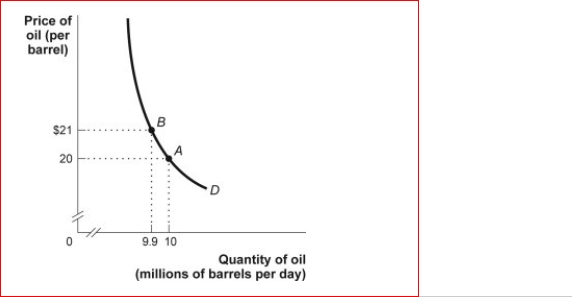 (Figure: Demand Curve for Oil) Look at the figure The Demand Curve for Oil.The price elasticity of demand between $20 and $21, using the midpoint method, is approximately:
A) 0.21.
B) 0.49.
C) 2.1.
D) 4.9.
Correct Answer:
Verified
Q34: A men's tie store sold an average
Q35: Figure: The Demand for Shirts
(Figure: The Demand
Q36: If the price of chocolate-covered peanuts decreases
Q37: If the price of chocolate-covered peanuts decreases
Q38: When the price of pencils decreases from
Q40: Suppose at a price of $10 the
Q41: Figure: The Demand for e-Books
(Figure: The Demand
Q42: Suppose at a price of $10 the
Q43: Table: Price Elasticity
(Table: Price Elasticity) Look at
Q44: Each month Jessica buys exactly 15 Big
Unlock this Answer For Free Now!
View this answer and more for free by performing one of the following actions

Scan the QR code to install the App and get 2 free unlocks

Unlock quizzes for free by uploading documents