Monthly sales were tracked and shown on the graph below. 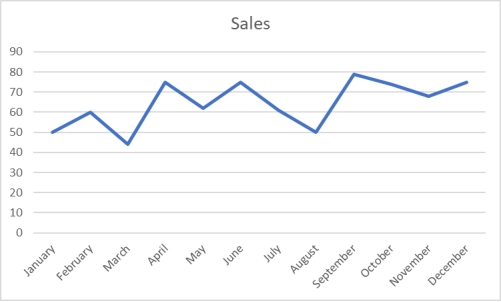 Which of the following would be an incorrect conclusion based on this graph?
A) Sales were lowest in the month of March.
B) Sales increased between August and September.
C) The last month had higher sales than the first month.
D) Sales declined from June through August.
E) The last month had higher sales than September.
Correct Answer:
Verified
Q77: The staff of Mr.Wayne Wertz, VP of
Q78: The staff of Mr.Wayne Wertz, VP of
Q79: The following graphic of residential housing data
Q80: Each day, the office staff at Oasis
Q81: A shirt production company has tracked their
Q83: Sales are tracked during the past year
Q84: Two other names for cross tabulations are
Q85: A shirt production company has tracked their
Q87: A shirt production company has tracked their
Q102: The following time-series data shows the
Unlock this Answer For Free Now!
View this answer and more for free by performing one of the following actions

Scan the QR code to install the App and get 2 free unlocks

Unlock quizzes for free by uploading documents