The following graphic of cigarettes smoked (sold) per capita (CIG) and deaths per 100K population from lung cancer (LUNG) indicates _________ 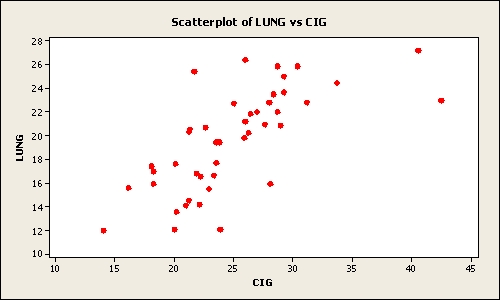
A) a weak negative relationship between the two variables
B) a somewhat positive relationship between the two variables
C) when the number of cigarettes smoked (sold) per capita (CIG) increases the deaths per 100K population from lung cancer (LUNG) decreases
D) a negative relationship between the two variables
E) no relationship between the two variables
Correct Answer:
Verified
Q83: If both variables being analyzed are nominal
Q84: Two other names for cross tabulations are
Q85: A shirt production company has tracked their
Q87: A shirt production company has tracked their
Q92: Sales are tracked during the past year
Q94: A shirt production company has tracked their
Q99: A retail shoe company would like to
Q102: The following time-series data shows the
Q103: The following time-series data shows the
Q104: To show hourly sales throughout a day,
Unlock this Answer For Free Now!
View this answer and more for free by performing one of the following actions

Scan the QR code to install the App and get 2 free unlocks

Unlock quizzes for free by uploading documents