Multiple Choice
This figure is an example of a: 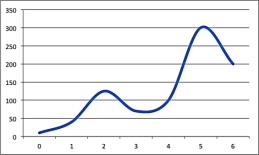
A) line graph.
B) scatterplot.
C) smoothed line graph.
D) bar graph.
Correct Answer:
Verified
Related Questions
Q40: Suppose the inflation rate of a country
Q41: When in doubt, where should we go
Q42: If you wanted to DE-EMPHASIZE a small
Q43: The population of the United States is
Q44: If inflation from year 1 to year
Q46: Data that depend upon the value of
Q47: According to a report, the percentage of
Q48: As an automobile ages, gas mileage typically
Q49: If inflation from year 1 to year
Q50: Any graph can be misleading if _
Unlock this Answer For Free Now!
View this answer and more for free by performing one of the following actions

Scan the QR code to install the App and get 2 free unlocks

Unlock quizzes for free by uploading documents