The following table shows the average starting salary of a certain job for the given year. 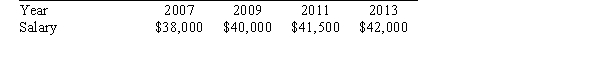 The starting salary as a function of time is _____ with _____ rate.
A) positive; increasing
B) positive; decreasing
C) negative; increasing
D) negative; decreasing
Correct Answer:
Verified
Q21: A rising line graph indicates a _
Q22: This figure is an example of a:
Q23: An epidemic is spreading by an average
Q24: This figure is an example of a:
Q25: The following table shows the number of
Q27: The following table shows the percentage of
Q28: A smoothed line graph is made from
Q29: The amount of tax you owe is
Q30: A study at ABC College found that
Q31: The following table shows the percentage of
Unlock this Answer For Free Now!
View this answer and more for free by performing one of the following actions

Scan the QR code to install the App and get 2 free unlocks

Unlock quizzes for free by uploading documents