The following table shows average life expectancy in years at birth in the given year:
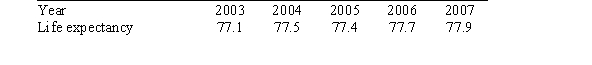 If t denotes the time in years since 2003 and E is the life expectancy in years, then the trend line for this data is given by E = 0.18t + 77.16. If this trend line persisted through 2012, what would be the average life expectancy in years of a child born in 2012?
A)78.8 years
B)79.0 years
C)78.6 years
D)79.2 years
Correct Answer:
Verified
Q4: On rural highways, the average speed S
Q5: Suppose that the cost of purchasing CDs
Q6: In the linear function y = mx
Q7: A function is called linear if it
Q8: The speed of sound at 0 degrees
Q10: This table shows the total number of
Q11: For the linear function y = mx
Q12: Suppose that a music club charges $12
Q13: This table shows the total number of
Q14: Given a set of data points, the
Unlock this Answer For Free Now!
View this answer and more for free by performing one of the following actions

Scan the QR code to install the App and get 2 free unlocks

Unlock quizzes for free by uploading documents