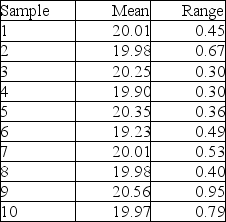
Ten samples of size four were taken from a process, and their weights measured. The sample averages and sample ranges are in the following table. Construct and plot an x-bar and R-chart using these data. Is the process in control?
Correct Answer:
Verified
View Answer
Unlock this answer now
Get Access to more Verified Answers free of charge
Q182: Examine the Statistical Process Control outputs below.
Q183: Why do range charts exist? Aren't x-bar
Q184: Repeated sampling of a certain process shows
Q185: A small, independent amusement park collects data
Q186: The width of a bronze bar is
Q188: The higher the process capability ratio, the
Q189: Larry's boat shop wants to monitor the
Q190: If μ = 9 ounces, σ =
Q191: A woodworker is concerned about the quality
Q192: What is the difference between natural and
Unlock this Answer For Free Now!
View this answer and more for free by performing one of the following actions

Scan the QR code to install the App and get 2 free unlocks

Unlock quizzes for free by uploading documents