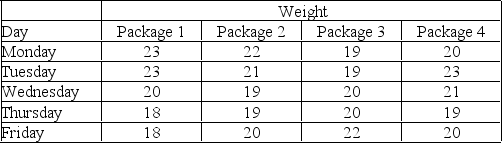
A quality analyst wants to construct a sample mean chart for controlling a packaging process. He knows from past experience that when the process is operating as intended, packaging weight is normally distributed with a mean of twenty ounces, and a process standard deviation of two ounces. Each day last week, he randomly selected four packages and weighed each. The data from that activity appear below.
 (a) If he sets an upper control limit of 21 and a lower control limit of 19 around the target value of twenty ounces, the control chart is based on what value of z?
(b) With the UCL and LCL of part a, what do you conclude about this process-is it in control?
Correct Answer:
Verified
View Answer
Unlock this answer now
Get Access to more Verified Answers free of charge
Q190: If μ = 9 ounces, σ =
Q191: A woodworker is concerned about the quality
Q192: What is the difference between natural and
Q193: The Cpk index measures the difference between
Q194: A process that is in statistical control
Q196: McDaniel Shipyards wants to develop a control
Q197: A hospital-billing auditor has been inspecting patient
Q198: A city police chief decides to do
Q199: A part that connects two levels should
Q200: A local manufacturer supplies you with parts,
Unlock this Answer For Free Now!
View this answer and more for free by performing one of the following actions

Scan the QR code to install the App and get 2 free unlocks

Unlock quizzes for free by uploading documents