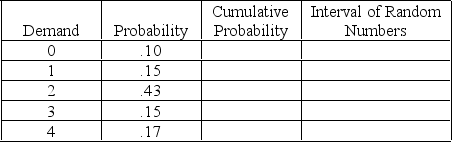
Suppose the following random numbers (1, 34, 22, 48, 56, 68, 00, 78) were selected during a Monte Carlo simulation that was based on the chart below. What was the average demand per period for the simulation? What is the expected demand?
Correct Answer:
Verified
View Answer
Unlock this answer now
Get Access to more Verified Answers free of charge
Q57: A distribution of service times at a
Q58: A distribution of service times at a
Q59: A(n) _ is the accumulation of individual
Q60: A distribution of service times at a
Q61: Explain how Monte Carlo simulation uses random
Q63: Complete the following table in preparation for
Q64: Historical records on a certain product indicate
Q65: Identify, in order, the five steps required
Q66: Explain the difference between random numbers and
Q67: Results of simulation experiments with large numbers
Unlock this Answer For Free Now!
View this answer and more for free by performing one of the following actions

Scan the QR code to install the App and get 2 free unlocks

Unlock quizzes for free by uploading documents