An analytics manager, Lauren, is reviewing the performance data of fifteen branch stores. She wants to create a heat map with symbols as in the figure below. What tool should she use? 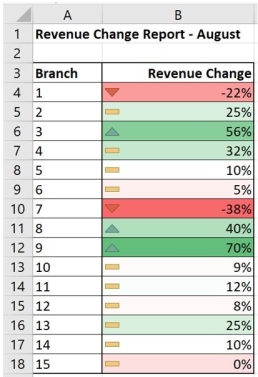
A) Select B4:B18; PivotTable
B) Select B4:B18; Conditional Formatting; Highlight Cells Rules
C) Select B4:B18; Conditional Formatting; Icon Sets
D) Select B1:B18; Conditional Formatting; Icon Sets
E) Select B4:B18; Conditional Formatting; Data Bars
Correct Answer:
Verified
Q43: Which of the following business analytics tools
Q44: A _ in Excel's Conditional Formatting changes
Q45: Which of the following data visualization graphs
Q46: Which of the following business analytics tools
Q47: Which of the following business analytics tools
Q49: Which of the following business analytics tools
Q50: The following figure is an example of
Q51: Which of the following is NOT one
Q52: A heat map uses colors to represent
Q53: Describe the three approaches for data mining.
Unlock this Answer For Free Now!
View this answer and more for free by performing one of the following actions

Scan the QR code to install the App and get 2 free unlocks

Unlock quizzes for free by uploading documents