A statistician wanted to determine if the demographic variables of age, education, and income influence the number of hours of television watched per week. A random sample of 25 adults was selected to estimate the multiple regression model:  where y is the number of hours of television watched last week, x1 is the age (in years), x2 is the number of years of education, and x3 is income (in $1,000). The computer output is shown below.
 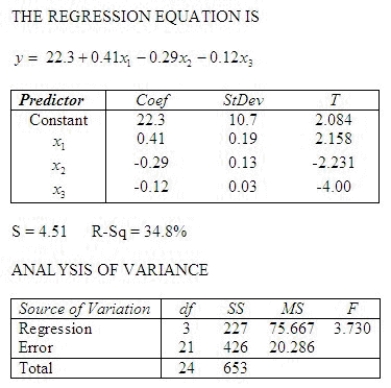 Test the overall validity of the model at the 5% significance level.
What is the test statistic?
F = ______________
______________  Conclude that the model ______________ valid at the 5% level.
Is there sufficient evidence at the 1% significance level to indicate that hours of television watched and age are linearly related?
What is test statistic?
t = ______________
______________  Conclude that there ______________ sufficient evidence at the 1% significance level to indicate that hours of television watched and age are linearly related.
Is there sufficient evidence at the 1% significance level to indicate that hours of television watched and education are negatively linearly related?
What is the test statistic?
t = ______________
______________  Conclude that there ______________ sufficient evidence at the 1% significance level to indicate that hours of television watched and education are negatively linearly related.
What is the coefficient of determination?  = ______________
Interpret this value for  :
:
________________________________________________________
Interpret  :
:
________________________________________________________
Interpret  :
:
________________________________________________________
Interpret  :
:
________________________________________________________
Correct Answer:
Verified
View Answer
Unlock this answer now
Get Access to more Verified Answers free of charge
Q163: Use the following partial output and residual
Q164: A medical study investigated the link between
Q165: An actuary wanted to develop a model
Q166: A publisher of college textbooks conducted a
Q167: The sequential sums of squares represent the
Q169: What is stepwise regression, and when is
Q170: A publisher is studying the effectiveness of
Q171: Consider the following partial output generated using
Q172: In general, on what basis are independent
Q173: Suppose you have a choice of three
Unlock this Answer For Free Now!
View this answer and more for free by performing one of the following actions

Scan the QR code to install the App and get 2 free unlocks

Unlock quizzes for free by uploading documents