Two gourmets, A and B, rated 22 meals on a scale of 1 to 10. The data are shown in the table. Do the data provide sufficient evidence to indicate that one of the gourmets tends to give higher ratings than the other? 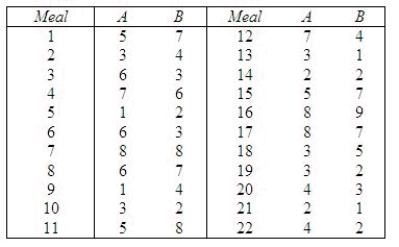 Test by using the sign test with a value of
  near 0.05.
The null and alternate hypotheses are as follows:  Critical Value approach:
What is the test statistic?
______________
Use the binomial tables to find the exact rejection region for the test.
Reject  if x
if x  ______________ or x
  ______________
Conclude:
______________
There ______________ enough evidence to indicate a difference between the two gourmets.
p-value approach:
Test Statistic:
______________
p-value = ______________
Conclude:
______________
There is ______________ enough evidence to indicate a difference between the two gourmets.
Use the large-sample z statistic for testing. (NOTE: Although the large-sample Approximation is suggested for  25, it works fairly well for values of n as small as 15.)
The large sample z-statistic is:
______________
The two-tailed rejection region is |z| > ______________.
Conclude:
______________
There is ______________ enough evidence to indicate a difference between the two gourmets.
Compare the results of the two tests.
The two tests give ______________ results.
Correct Answer:
Verified
View Answer
Unlock this answer now
Get Access to more Verified Answers free of charge
Q131: A parametric test is a hypothesis test
Q135: Nonparametric statistical methods generally specify hypotheses in
Q137: The Wilcoxon Rank Sum Test is a
Q138: The Wilcoxon rank-sum test is a nonparametric
Q139: The Wilcoxon rank sum test is a
Q141: A two-sample t-test with independent samples corresponds
Q142: The procedure for the Wilcoxon rank sum
Q143: You are performing the Wilcoxon rank-sum test.
Q144: The Wilcoxon rank sum test is used
Q145: A Wilcoxon rank sum test for comparing
Unlock this Answer For Free Now!
View this answer and more for free by performing one of the following actions

Scan the QR code to install the App and get 2 free unlocks

Unlock quizzes for free by uploading documents