The reaction times to three stimuli were recorded for each of 8 subjects. The data, recorded in seconds, are shown below. This problem uses Friedman's  test to determine if there is a difference among the population distributions of reaction times.
 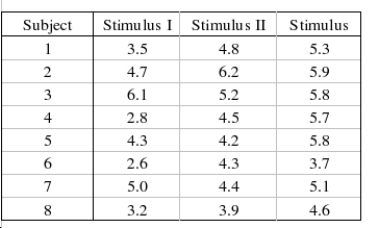 What experimental design is being used in this problem?
____________________________
The null and alternate hypotheses are as follows:  : The three population distributions are identical.
  : At least two of the three population distributions differ in location.
Describe what the Test statistic  is.
is.
________________________________________________________
Test statistic:  = ______________
Rejection region for  =0.05:
Reject  if
if  > ______________
Conclusion: ______________
There is ______________ evidence to conclude that the reaction times for the three stimuli are different.
Estimate the p-value for this problem?
______________
Correct Answer:
Verified
View Answer
Unlock this answer now
Get Access to more Verified Answers free of charge
Q20: The Friedman test is a nonparametric test
Q21: A three independent samples one-way analysis of
Q22: A toy store manager was interested in
Q23: The following data were generated from a
Q24: If Friedman test is applied to a
Q26: Another school district also planned to evaluate
Q27: A randomized block design analysis of variance
Q28: To apply the Friedman test to determine
Q29: The restaurant critic on a newspaper claims
Q30: The Friedman test is the nonparametric counterpart
Unlock this Answer For Free Now!
View this answer and more for free by performing one of the following actions

Scan the QR code to install the App and get 2 free unlocks

Unlock quizzes for free by uploading documents