Multiple Choice
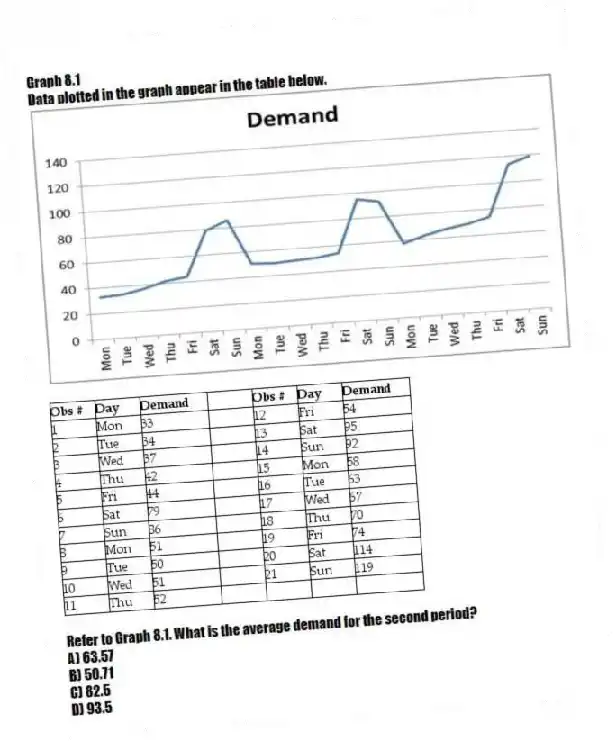
Graph 8.1
Data plotted in the graph appear in the table below.


-Refer to Graph 8.1. What is the average demand for the second period?
A) 63.57
B) 50.71
C) 82.5
D) 93.5
Correct Answer:
Verified
Related Questions
Q110: Table 8.7
A sales manager wants to forecast
Q111: Table 8.9
Consider the following results from the
Q112: Table 8.7
A sales manager wants to forecast
Q113: In an exponential smoothing model a _
Q114: Graph 8.1
Data plotted in the graph appear
Q116: Table 8.7
A sales manager wants to forecast
Unlock this Answer For Free Now!
View this answer and more for free by performing one of the following actions

Scan the QR code to install the App and get 2 free unlocks

Unlock quizzes for free by uploading documents