
Four samples of 100 each were taken from an assembly line, with the following results: 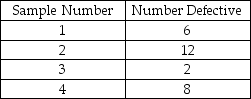
Using the historical average as the central line of the chart, which one of the following is the limit for an attributes control chart with z = 2?
A) UCL > 0.1 and LCL > 0.03
B) UCL > 0.1 and LCL < 0.03
C) UCL < 0.1 and LCL > 0.03
D) UCL < 0.1 and LCL < 0.03
Correct Answer:
Verified
Q132: Use the data in Table 5.4. What
Q133: A(n) _ specifies the sample size, the
Q134: A hotel tracks the number of complaints
Q135: A hotel tracks the number of complaints
Q136: The UCL and LCL for an
Q138: Table 5.4
The manager of Champion Cooling Company
Q139: Table 5.4
The manager of Champion Cooling Company
Q140: A hotel tracks the number of complaints
Q141: The upper and lower control limits for
Q142: The quality control technician grew weary of
Unlock this Answer For Free Now!
View this answer and more for free by performing one of the following actions

Scan the QR code to install the App and get 2 free unlocks

Unlock quizzes for free by uploading documents