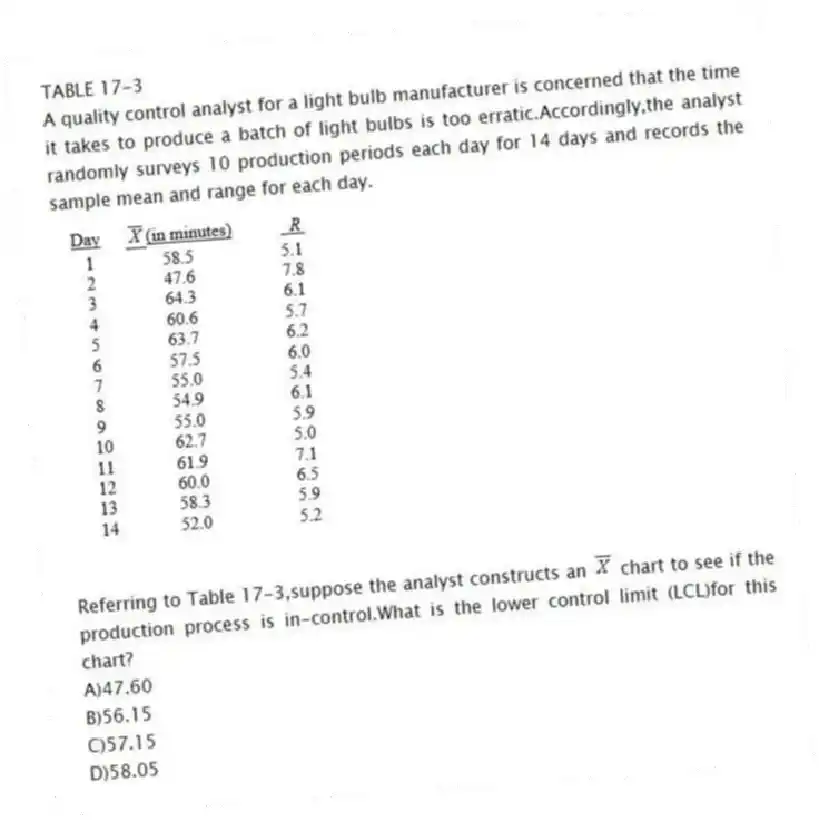
TABLE 17-3
A quality control analyst for a light bulb manufacturer is concerned that the time it takes to produce a batch of light bulbs is too erratic.Accordingly,the analyst randomly surveys 10 production periods each day for 14 days and records the sample mean and range for each day.
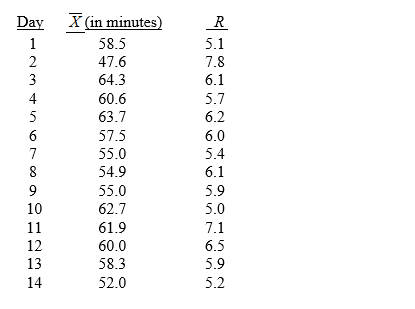
-Referring to Table 17-3,suppose the analyst constructs an  chart to see if the production process is in-control.What is the lower control limit (LCL) for this chart?
A) 47.60
B) 56.15
C) 57.15
D) 58.05
Correct Answer:
Verified
Q25: Referring to Table 17-4, what is the
Q25: TABLE 17-3
A quality control analyst for a
Q26: TABLE 17-4
A factory supervisor is concerned that
Q28: Referring to Table 17-4, what is the
Q32: TABLE 17-4
A factory supervisor is concerned that
Q35: Referring to Table 17-4, what is the
Q36: TABLE 17-3
A quality control analyst for a
Q37: TABLE 17-4
A factory supervisor is concerned that
Q37: The control limits are based on the
Q38: TABLE 17-3
A quality control analyst for a
Unlock this Answer For Free Now!
View this answer and more for free by performing one of the following actions

Scan the QR code to install the App and get 2 free unlocks

Unlock quizzes for free by uploading documents