TABLE 2-10
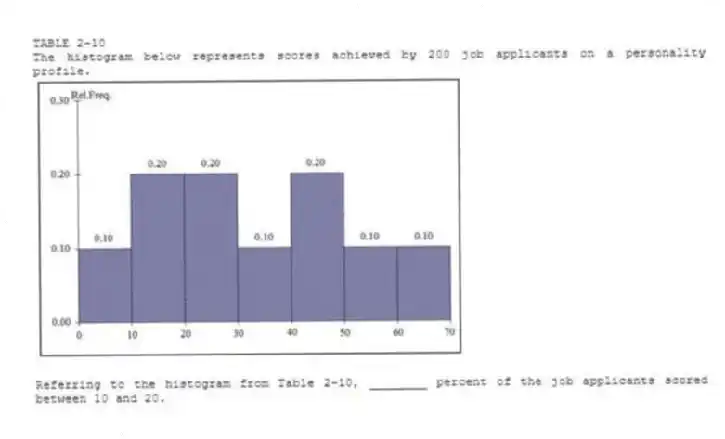
The histogram below represents scores achieved by 200 job applicants on a personality profile.

-Referring to the histogram from Table 2-10, ________ percent of the job applicants scored between 10 and 20.
Correct Answer:
Verified
Q63: TABLE 2-7
The Stem-and-Leaf display below contains data
Q64: TABLE 2-8
The Stem-and-Leaf display represents the number
Q65: TABLE 2-9
The frequency distribution below represents the
Q66: TABLE 2-7
The Stem-and-Leaf display below contains data
Q67: TABLE 2-8
The Stem-and-Leaf display represents the number
Q69: TABLE 2-8
The Stem-and-Leaf display represents the number
Q70: TABLE 2-8
The Stem-and-Leaf display represents the number
Q71: TABLE 2-8
The Stem-and-Leaf display represents the number
Q72: TABLE 2-10
The histogram below represents scores achieved
Q73: TABLE 2-9
The frequency distribution below represents the
Unlock this Answer For Free Now!
View this answer and more for free by performing one of the following actions

Scan the QR code to install the App and get 2 free unlocks

Unlock quizzes for free by uploading documents