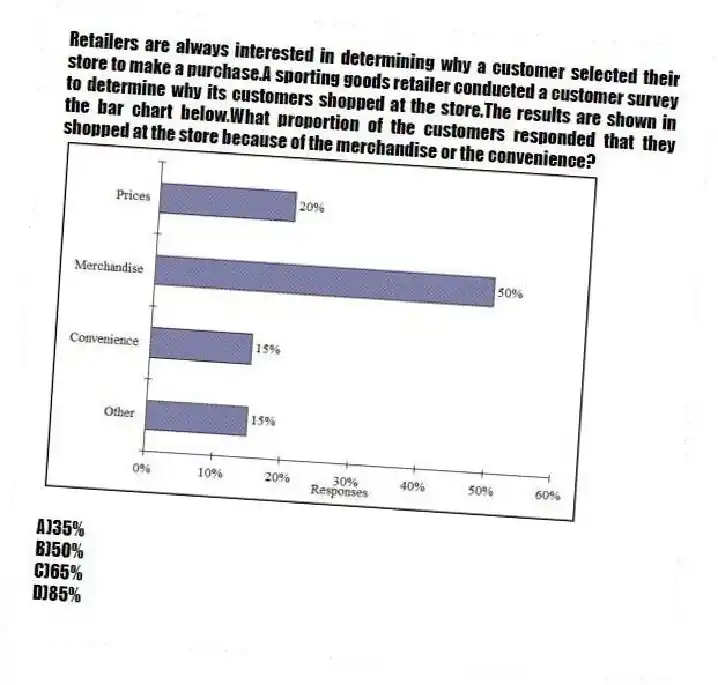
Retailers are always interested in determining why a customer selected their store to make a purchase.A sporting goods retailer conducted a customer survey to determine why its customers shopped at the store.The results are shown in the bar chart below.What proportion of the customers responded that they shopped at the store because of the merchandise or the convenience? 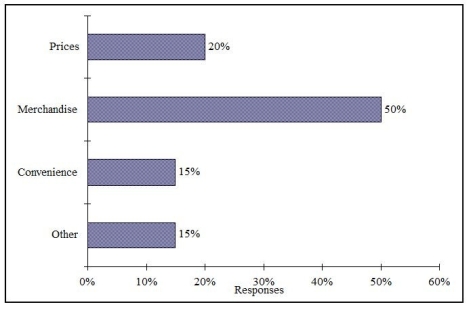
A) 35%
B) 50%
C) 65%
D) 85%
Correct Answer:
Verified
Q41: TABLE 2-6
A sample of 200 students at
Q44: TABLE 2-7
The Stem-and-Leaf display below contains data
Q49: TABLE 2-7
The Stem-and-Leaf display below contains data
Q50: In a contingency table,the number of rows
Q60: You have collected data on the number
Q65: TABLE 2-9
The frequency distribution below represents the
Q70: TABLE 2-8
The Stem-and-Leaf display represents the number
Q77: TABLE 2-8
The Stem-and-Leaf display represents the number
Q79: TABLE 2-8
The Stem-and-Leaf display represents the number
Q80: TABLE 2-7
The Stem-and-Leaf display below contains data
Unlock this Answer For Free Now!
View this answer and more for free by performing one of the following actions

Scan the QR code to install the App and get 2 free unlocks

Unlock quizzes for free by uploading documents