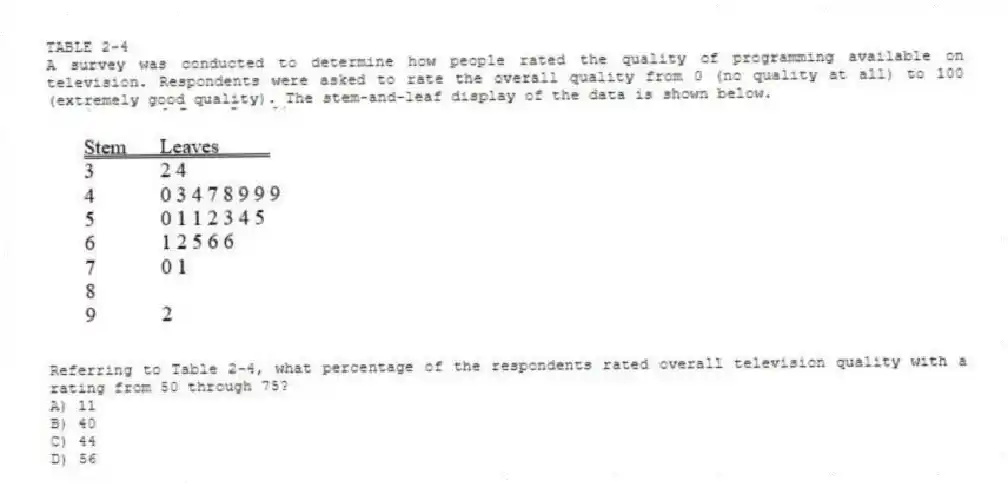
TABLE 2-4
A survey was conducted to determine how people rated the quality of programming available on television. Respondents were asked to rate the overall quality from 0 (no quality at all) to 100 (extremely good quality) . The stem-and-leaf display of the data is shown below.
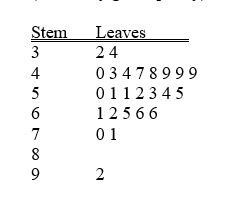
-Referring to Table 2-4, what percentage of the respondents rated overall television quality with a rating from 50 through 75?
A) 11
B) 40
C) 44
D) 56
Correct Answer:
Verified
Q11: When constructing charts,the following is plotted at
Q13: SCENARIO 2-2
2-2 Organizing and Visualizing Variables
At a
Q19: TABLE 2-1
An insurance company evaluates many numerical
Q21: TABLE 2-5
The following are the duration in
Q21: One of the developing countries is experiencing
Q24: TABLE 2-5
The following are the duration in
Q25: Data on 1,500 students' height were collected
Q26: TABLE 2-5
The following are the duration in
Q27: TABLE 2-5
The following are the duration in
Q127: Jared was working on a project to
Unlock this Answer For Free Now!
View this answer and more for free by performing one of the following actions

Scan the QR code to install the App and get 2 free unlocks

Unlock quizzes for free by uploading documents