The graph below shows a plot of angular acceleration in rad/s2 versus time from t = 0 s to t = 8 s. The change in angular velocity, Δω, during this 8-second period is 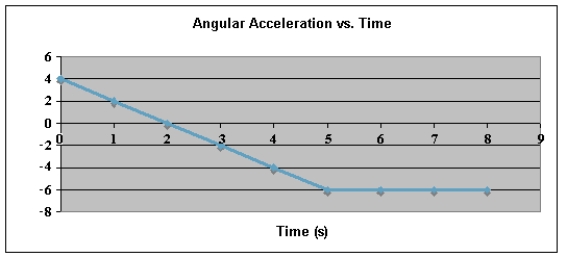
A)  , CW.
, CW.
B)  , CCW.
C)  , CW.
, CW.
D)  , CCW.
E)  , CW.
, CW.
Correct Answer:
Verified
Q56: Two people are on a ride where
Q57: The rigid body shown is rotated about
Q58: The figure below shows a graph of
Q59: A uniform rod (length = 2.4 m)
Q60: Two forces of magnitude 50 N, as
Q62: A horizontal force of magnitude 6.5 N
Q63: A solid sphere, a solid cylinder, and
Q64: The graph below shows a plot of
Q65: The net work done in accelerating a
Q66: A small sphere attached to a light
Unlock this Answer For Free Now!
View this answer and more for free by performing one of the following actions

Scan the QR code to install the App and get 2 free unlocks

Unlock quizzes for free by uploading documents