Short Answer
The graph of  is shown in the following figure. Estimate
  (to the nearest integer).
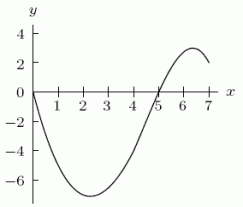
Correct Answer:
Verified
Related Questions
Q168: Consider the function Q169: Sketch a well-labeled graph of a periodic Q170: The size of a bird population on Q171: If Q172: Temperatures in a room oscillate between the Q174: The size of a bird population on Q175: Consider the functions Q176: In nature, the populations of two animals, Q177: The graph of Q178: The graph of Unlock this Answer For Free Now! View this answer and more for free by performing one of the following actions Scan the QR code to install the App and get 2 free unlocks Unlock quizzes for free by uploading documents![]()
![]()
![]()
![]()
![]()

