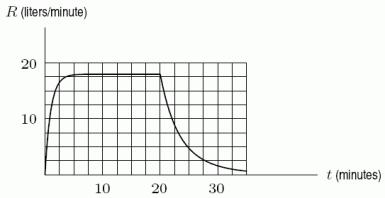
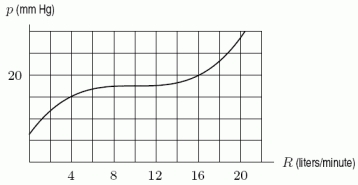
One of the graphs below shows the rate of flow, R, of blood from the heart in a man who bicycles for 20 minutes, starting at t = 0 minutes. The other graph shows the pressure, p, in the artery leading to a man's lungs as a function of the rate of flow of blood from the heart. Estimate  .
. 
A) 15 mm Hg
B) 11 mm Hg
C) 19 mm Hg
D) 7 mm Hg
Correct Answer:
Verified
Q15: The illumination, I, of a candle is
Q132: Given the function Q133: For Q134: For Q135: Let Q136: You have $500 invested in an account Q138: Bank A offers 12% interest, compounded yearly, Q139: What is the equation for the graph Q140: If the graph of Q142: Of the functions Unlock this Answer For Free Now! View this answer and more for free by performing one of the following actions Scan the QR code to install the App and get 2 free unlocks Unlock quizzes for free by uploading documents![]()
![]()
![]()
![]()
![]()
![]()

