Multiple Choice
Consider the following graph. Between point A and point B, the graph is: (mark all that apply) 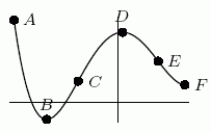
A) decreasing
B) increasing
C) concave up
D) concave down
Correct Answer:
Verified
Related Questions
Q29: A $2000 pump depreciates linearly. It is
Q30: The number of reported offenses of violent
Q31: Values for g(x) are given in the
Unlock this Answer For Free Now!
View this answer and more for free by performing one of the following actions

Scan the QR code to install the App and get 2 free unlocks

Unlock quizzes for free by uploading documents